
As we enter our second calendar year with Statewide rent control, the cap will vary from year to year based on the CPI. The Oregon Office of Economic Analysis just announced that the annual rent caps for 2020 will be 9.9%. Accepting that rent control is here to stay, I don’t see many objections to this annual cap. The full article from Josh Lehner is available here.

Commercial real estate forecast: Tracking Portland multifamily trends and transactions
We recently wrote a guest column for Portland Business Journal that covered the current state of the apartment market. You can find a link to the article or just the text of the article below.
Commercial real estate forecast: Tracking Portland multifamily trends and transactions

Barry Apartment Newsletter- Summer 2019
2019 Mid Year Update: Stable Fundamentals, but …...Some Slowdown
YTD 2019 has seen some shift and transition in the Portland area apartment market. Vacancies have crept up, rents are flattening out, and permits are down. Despite declining interest rates and solid job growth, apartment sales volume is way off, and the political climate in the city of Portland appears to be impacting investor interest.

Concerning Figures Regarding Apartment Investment Post Rent Control
Let’s hope this is an incident not a trend. If out of state investment dries up in Portland Metro, this will have an adverse impact across the entire apartment market.
The full article from Emily Anderer at CoStar can be found below.
Following Statewide Rent Cap, Oregon Multifamily Investment Drops 38%

May 2019 Snapshot - Portland Apartment Market
With only 60 Portland apartment sales for YTD 2019, it may be too early to reach any reliable conclusions on value trends. However, these 60 sales suggest flat values and a slow down in transactions/sales volume. Given that we averaged 225 apartment transactions from 2013-2018, we anticipate a stronger sales market in the balance of 2019.

Portland Apartment Construction - Permits on the Rise
Monthly permits for new apartments peaked in mid-2017 and were trending down. However, since August 2018, apartment permits have been on the rise. The chart below shows number of units that have been permitted monthly in Portland Metro. The average since 2016 is around 700 units per month. This is somewhat surprising given the increased headwinds (construction costs, IH, etc.) faced by the development community.

2018 Year End Summary
With all of the 2018 Portland Metro apartments sales now accounted for, it was another strong year by all measures. Sales volume was up 29%, number of transactions were up 17%, and median values were up 7-12%.


Forecasting Portland Apartment Cap Rates
Forecasting cap rates is no easy task, but looking at historical trends can help. This chart presents 10 year treasury yields in blue and cap rates for Portland apartments (Source: CoStar) in orange. While the spread has varied, these two rates have mostly moved in the same direction. The average spread since 2000 has been 330 basis points.

Portland Apartment Market Update - Mid-December 2018
With the vast majority of 2018 in the books, how did the apartment market fair in 2018? In most ways, 2018 was a good year for apartments. Rents are up over the past 12 months, per unit and per Sq. Ft. values are up, cap rates are down, though vacancies are rising. As of mid-December 2018, we've exceeded 2017 in both sales volume and number of transactions. YTD 2018 annualized construction permits are down 30% from 2017, though it will still be a top 5 busiest year of all time.
Sales of properties in Multnomah County accounted for 67% of all transactions. As of mid-December 2018, Clark County and Clackamas County only saw 12 and 16 sales, respectively, both down from last year.

2018-2019 Multnomah County Property Taxes Announced
It's that time of year again and Multnomah County has published the 2018-2019 property taxes. I did a quick survey of 10 apartments and property taxes were up 3.8 to 4.3 percent. Use the guest login at the link below to see how your property fared.

How Investor Profile Impacts Prices - Portland Apartment Market
As appraisers, a common question we receive is why a specific sale was excluded/included. Many decisions come down to investor profile. The graphs herein illustrate why this is critical. The substantial price differences based solely on number of units at the property is a difficult metric to disregard. Any of your thoughts on this topic are appreciated.

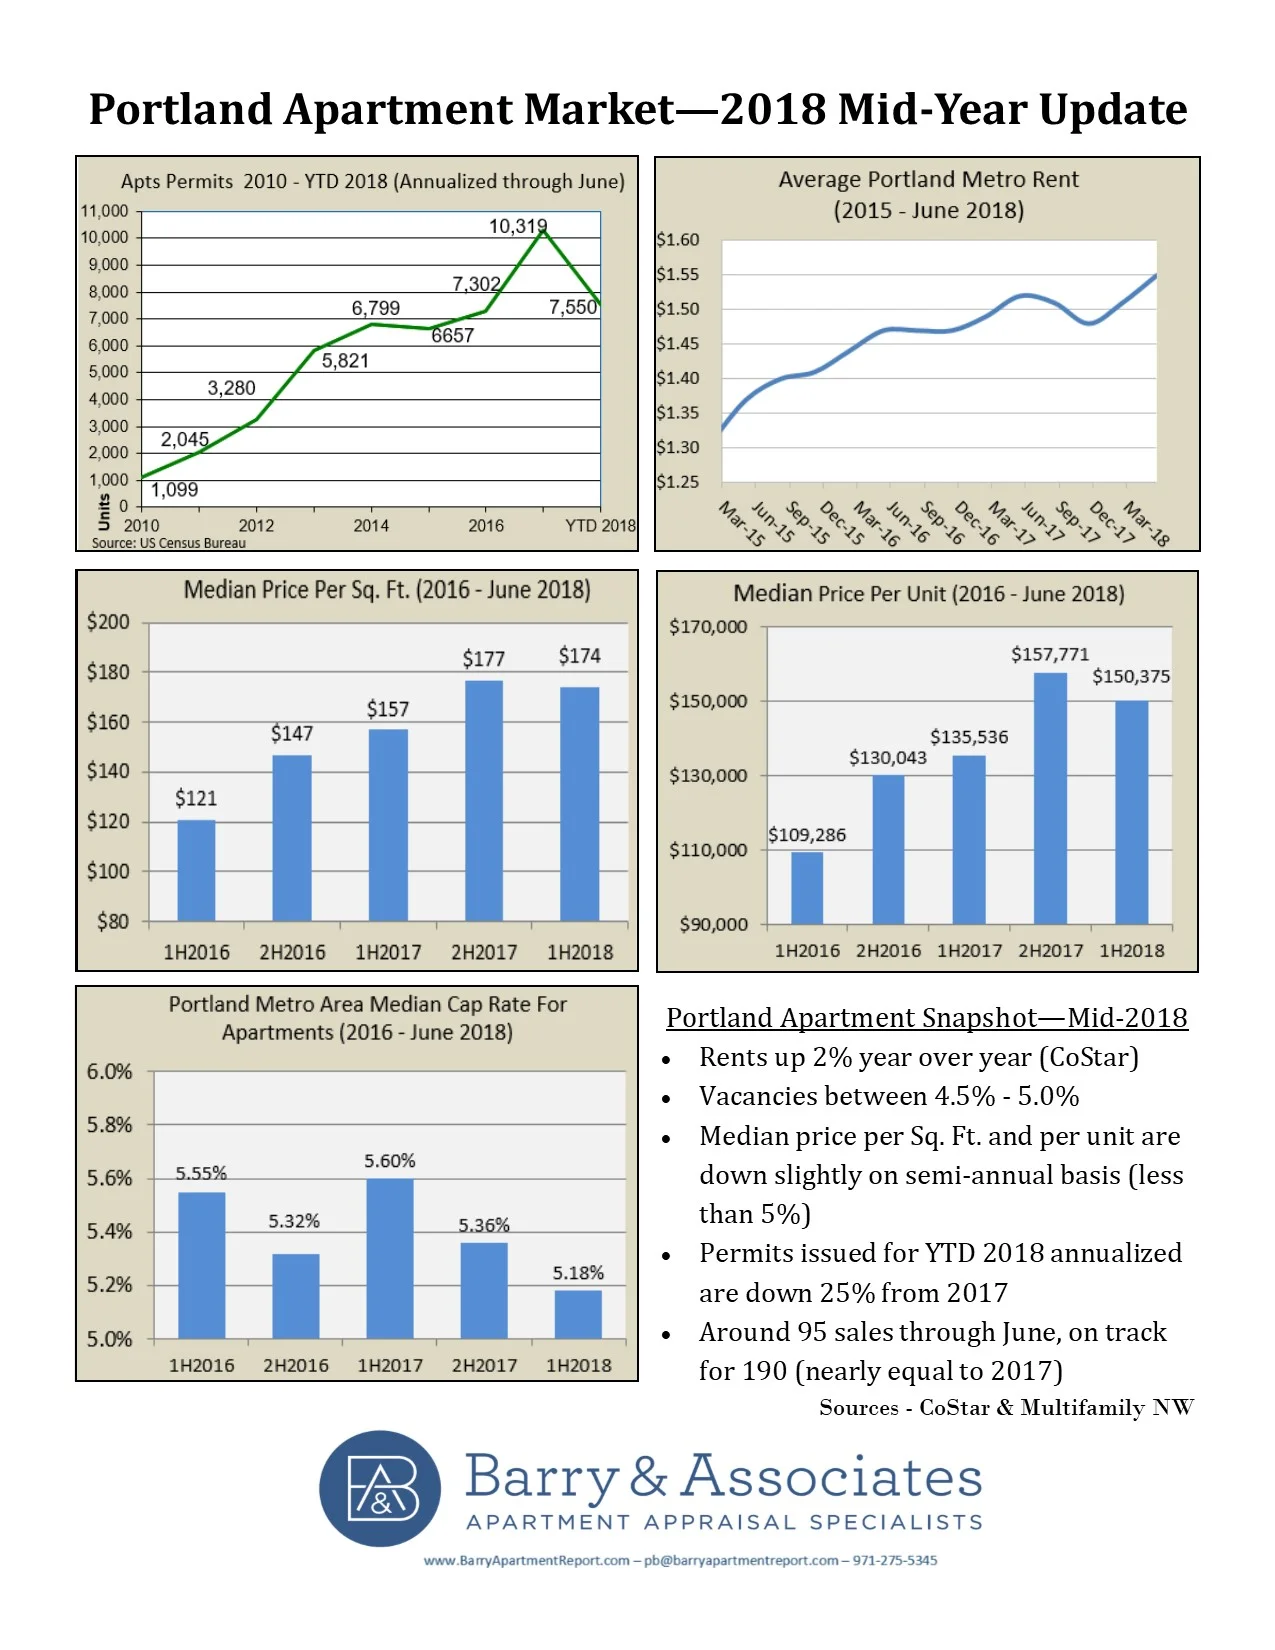
Portland Apartment Market—2018 Mid-Year Update
With all apartment sales through the first half of 2018 now accounted for, how is the year shaping up? In short, the mixed signals continue. Rents are up, per unit and per Sq. Ft. values are down, cap rates are down, and vacancies are up. None of this has slowed sales, as we are on pace to reach 190 transactions, or close to 2017. Lastly, YTD 2018 annualized construction permits are down 25% from 2017, which means apartment completions will likely accelerate for the balance of 2018 and in to 2019.
It's also become increasingly difficult to enter the market for less than $100,000 per unit, no matter where you are in the four county metro area. In 2015, there were 124 sales for less than $100,000 per unit. This dropped to 84 in 2016, 33 in 2017, and only 11 for YTD 2018.
4 Indicators to Judge the Health of an Apartment Market… and how they apply to Portland
There are countless indicators to judge the health of an apartment market, though many are difficult to understand or provide too much detail for the average participant. Below are four macro indicators that we track to judge the overall health of the market, and only one is apartment specific. We’ve also added some commentary on how they apply to the Portland apartment market.
- Interest rates - I think most agree that interest rates are not going down. Eventually rising interest rates will begin to push cap rates.
- Employment - Portland MSA employment remains very strong. We have gained 31,000 jobs year over year, and unemployment remains at record lows
- Home ownership ratio - Exact figures are tough to nail down, but there is a general consensus that home ownership is increasing, which hurts apartments, especially apartments with high rents. Keep in mind that a 1% increase in home-ownership in the Portland MSA means 8,000 fewer households in the market for rental housing
- Apartment Construction - Portland has reached peak levels of apartment construction not seen since the 1970’s. Some oversupply is likely in the near term.

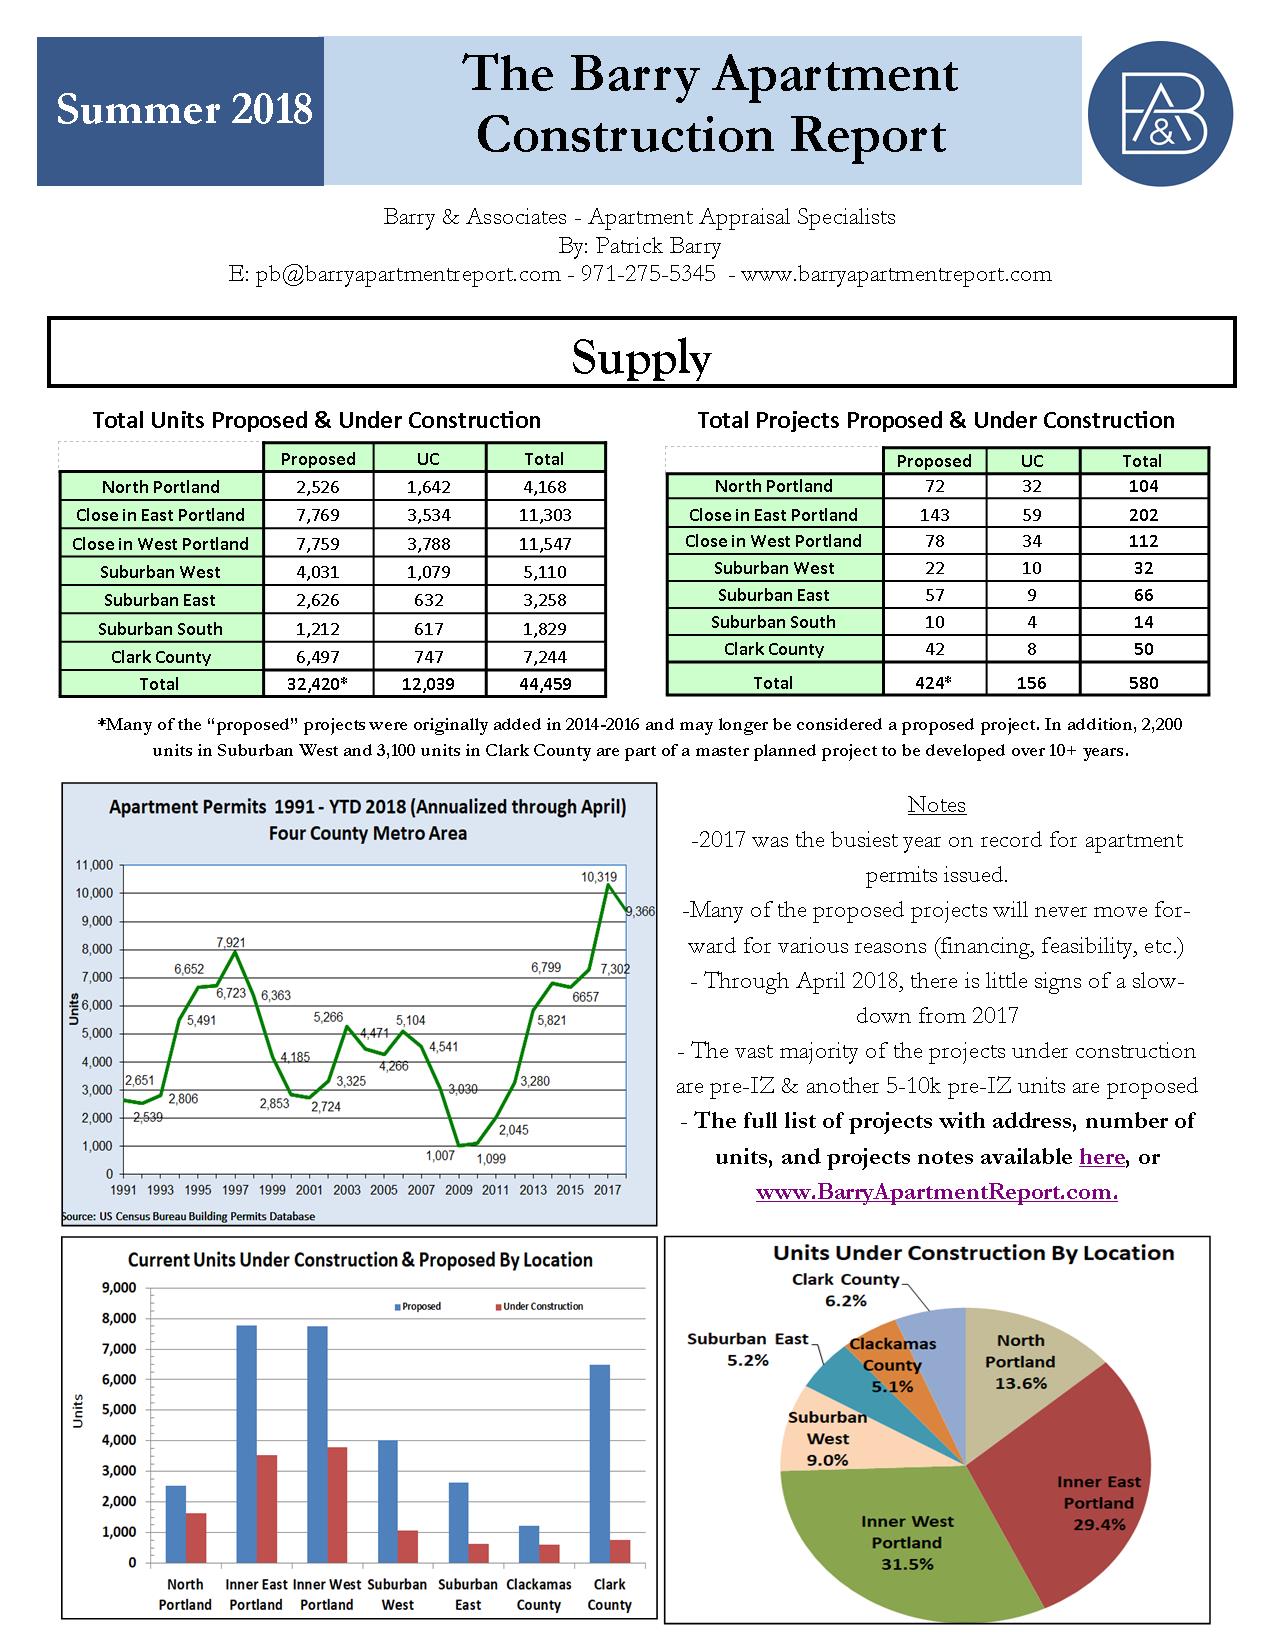
Summer 2018 - Barry Apartment Construction Report
While I've continued to track apartment construction since my last report in 2016, finding the time to compile the information for a report hasn't occurred. Well...I found the time and here is my latest report.
The following report attempts to summarize Portland metro's current supply of construction (both proposed and under construction), and also addresses where prices have come in on both completed apartments and apartment land.
Summer 2018 - Barry Apartment Construction Report


Portland Apartment Market - YTD 2018 Snapshot
The Portland Apartment market is sending a few mixed signals for YTD 2018. As more transactions close, we expect better clarity as to how buyers and sellers are reacting to our transitioning market.

2018 Forecast: Some Signs of Weakness and a Return to Normal
The Portland apartment market has been on an unprecedented run since 2014. However, the reality of a "normal" market may be setting in as we see increased vacancies, flat or modest rent increases, peak apartment completions, and rising interest rates. But, up to this point, values have barely flinched, jobs growth remains strong, wage growth is finally happening, and long term prospects for Portland remain strong.
We recently published our Annual Barry Apartment Report. We've summed up what occurred in 2017 and where we see things headed in 2018.

2017 - Market Snapshot - Values, Volume, & Transactions
Now that the dust has settled, how did the Portland Apartment market fare in 2017? There are a few ways of approaching this question.
- 2017 Sales Volume - $1.7 billion - Portland apartment sales volume decreased by 48% from 2016, which sounds a bit frightening on the surface. However, 2017 will be the third largest year ever for apartment sales volume.
- 2017 Transactions - 192 Sales - The number of Portland apartment transactions was down 27% from 2016. Despite the sharp decrease, 2017 was one of the top 10 busiest years ever.
- Median Price Per Unit - $149,000 - On a per unit basis, values haven't skipped a beat. On a year over year basis, values were up 25% per unit, which is quite staggering.
- Median Price Per Sq. Ft. - $164 - When considering the median price per Sq. Ft., values were up 26% from 2016. Another staggering increase.
- Overall Capitalization Rates - 5.45% - Cap rates were flat from 2016. This would suggest little change in values if the net income were flat. However, income and net income has generally been increasing.
Despite sales volume and the number of transactions being down from previous years (which were all-time highs), the Portland apartment market is showing little signs of weakness. Values were up across all sub-markets and investor demand remains high.
However, some concerns are out there with regards to increasing vacancies, a slow down in rental rate increases, a large volume of new units hitting the market in 2018 and 2019. I will address these issues in a future post.

Information Source: CoStar
2017 Portland Apartment Construction - 10,000+ Permits Issued
The US Census Bureau has released their final figures for housing permits issued. The Portland four county metro area issued permits for 10,319 multifamily units in 2017. This is over 3,000 more units than 2016 and will represent the busiest year ever for Portland apartment construction. Keep in mind these are not applications or inquiries, but actual permits issued.

Multnomah County has by far the largest share of permits issued, with Clark and Washington County following behind. Clackamas County remains slow. This surge of permits is partially due to enactment of Inclusionary Zoning (IZ) in the City of Portland, which pushed developers to apply for permits prior to February 1, 2017. Very few of the permits issued in 2017 were participating in the IZ Program. Pre-IZ permits will continue in to 2018 as these projects work their way through the system.
URM Mandates - Portland Apartments
The City of Portland is in the final stages of passing a mandate that requires owners of Unreinforced Masonry (URM) buildings to complete extensive (and expensive) retrofits. While some uncertainty remains, the bulk of the retrofit requirements and incentives appear to be set.
We’ve completed a number of recent appraisals of URM and physically similar non-URM buildings. We’ve analyzed all of the relevant value indicators, and are seeing about a 5%-10% discount, which is at the low end or below the potential cost impact. However, due to the very limited number of current sales, it can be difficult to identify exactly what is driving the discount (location, condition, income/expenses, overall market conditions.....or the URM status).
There are a number of potential reasons for a lack of discount.
- The possibility of having to comply with more stringent regulations and thus face additional costs is a new phenomenon that has not been readily apparent until recently. The City of Portland introduced potential retrofit requirements in December 2014, though it was not until April 2017 when a report was provided detailing potential requirements and potential costs.
- Very strong investor demand for well-located urban properties, and investors possibly discounting future risks based on the strong urban location of most URM buildings
While some form of mandatory compliance is likely.
The final mandates have not been approved by Portland City Council
The timing could extended out as far as 25 years
There is uncertainty on the financial benefit of the incentive offered
With the final mandates likely to be approved, and cost estimates floating around, we think the discount will grow. Retrofit estimates are $20-$70/Sq. Ft., or maybe 7%-25% of value. I've spoken with some owners who believe the actual costs will be higher. The City of Portland has proposed many incentives, but there is uncertainty on the financial impact. We are watching this issue closely both on the regulatory requirements and the sales.
The NW Examiner recently wrote a great article from the perspective of a few different local market participants. In addition, the full report from the City of Portland can be found here.

City of Portland - URM Retrofit Cost Estimates
Politics Around Portland's Rental Market - In One Graph
Anyone familiar with the Portland apartment market is well aware of the friction between tenants and building owners that arose in recent years. There are many underlying factors that contributed to these tensions that I will not dive in to. But, I believe this one graph perfectly sums up when and why the tension began.
The chart below from CoStar tracks Portland Rent Growth vs. Income Growth. From 2006 to mid-2014, rent growth and income growth moved mostly in tandem. However, starting in mid-2014 things changed and rent growth increased much faster than income growth. The graph shows an obvious divergence from mid-2014 though mid-2016. When looking at this graph, the anger felt by tenants in understandable.
According to CoStar, as of mid-2016 the trend appears to have reversed itself with rent growth dipping below income growth. However, the damage has been done and the tension between tenants and building owners doesn't appear to be going away anytime soon.